ข้อมูลการปฏิบัติที่ดีที่สุด (Best Practice) ของกรุงพนมเปญ ราชอาณาจักรกัมพูชา
การจัดการมูลฝอยชุมชน (Municipal Solid Waste (MSW) Management)
- ขอบข่ายด้านกฎหมายและนโยบาย
รัฐบาลกลางและกรุงพนมเปญได้ออกกฎหมาย ข้อกำหนด ประกาศ กฤษฎีกาย่อย และคำสั่งต่าง ๆ เกี่ยวข้องกับการจัดการมูลฝอยในช่วงหลายปีที่ผ่านมานี้
ข้อกำหนดระดับประเทศ ได้แก่
- กฤษฎีกาย่อยการจัดการมูลฝอย ฉบับที่ 36 (ค.ศ. 1999)
- ประกาศร่วมจากกระทรวงมหาดไทยและกระทรวงสิ่งแวดล้อมด้านการจัดการขยะและมูลฝอยของจังหวัดและชุมชนในประเทศกัมพูชา ฉบับที่ 80 (ค.ศ. 2003)
- กฤษฎีกาย่อยการจัดการมูลฝอยเมือง ฉบับที่ 113 (ค.ศ. 2015)
- ยุทธศาสตร์และแผนปฏิบัติการด้านการจัดการมูลฝอยของประเทศกัมพูชา (ตามที่ได้วางแผนไว้)
ข้อกำหนดระดับท้องถิ่น ได้แก่
- ร่างยุทธศาสตร์และระเบียบการปรับปรุงการจัดการ การทำความสะอาด การจัดเก็บ และขนส่งมูลฝอยในกรุงพนมเปญ
- ประกาศ (เสกเดย์ จุน ดำเนือง) การจัดเก็บมูลฝอย การทำความสะอาด การระบายน้ำเสีย
และการลงโทษสำหรับการทำลายมูลฝอยอย่างไม่ถูกต้องในกรุงพนมเปญ ฉบับที่ 13 (ค.ศ. 2013)
- แผนคำสั่งการนำบทลงโทษไปใช้เพื่อส่งเสริมการพัฒนาด้านสุขาภิบาลสิ่งแวดล้อมในกรุงพนมเปญ
ฉบับที่ 09 (ค.ศ. 2010)
- คำสั่ง (เสกเดย์ นายนวม) การลงโทษการกำจัดมูลฝอยในพื้นที่สาธารณะ ฉบับที่ 16 (ค.ศ. 2010)
- แผนดำเนินการเพื่อการส่งเสริมการคัดแยกมูลฝอยในกรุงพนมเปญ ฉบับที่ 08 (ค.ศ. 2010)
- การจัดเก็บมูลฝอย การทำความสะอาด การระบายน้ำเสีย และการลงโทษสำหรับการทำลายมูลฝอยอย่างไม่ถูกต้องในกรุงพนมเปญ (ค.ศ. 2013)
- การผลิตมูลฝอย
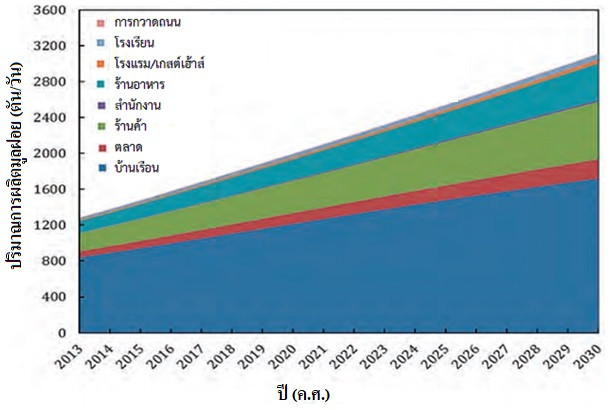
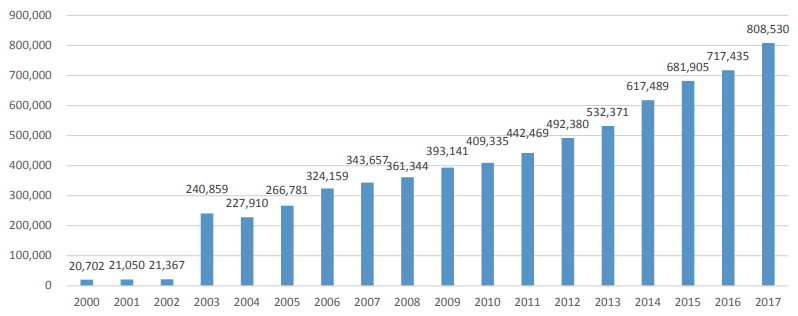
(ดูแผนภูมิที่ 1) สถาบันเทคโนโลยีแห่งกัมพูชา (Institute of Technology of Cambodia) ได้คาดการณ์ว่าแนวโน้มของการผลิตมูลฝอยในกรุงพนมเปญจะมีปริมาณเพิ่มขึ้นอย่างต่อเนื่องไปจนถึงปี พ.ศ. 2573 จำนวนประชากรที่เพิ่มขึ้นในกรุงพนมเปญ และการผลิตมูลฝอยจากแหล่งที่มาของมูลฝอยส่งผลให้ปริมาณมูลฝอยชุมชนที่นำไปฝังกลบมีปริมาณเพิ่มขึ้นอย่างรวดเร็วในรอบ 20 ปี ที่ผ่านมานี้ อย่างไรก็ดี
ต้องขอบคุณสำหรับความพยายามอย่างสูงของกรุงพนมเปญ (The Phnom Penh Capital Administration: PPCA) ผู้ให้บริการด้านการจัดเก็บมูลฝอย และผู้พักอาศัยที่ทำให้แนวโน้มการจัดเก็บ
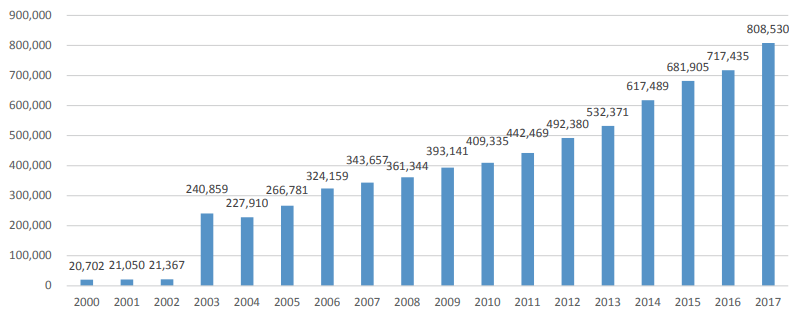
มูลฝอยมีปริมาณเพิ่มขึ้นอย่างเห็นได้ชัดในหลายปีที่ผ่านมา (ดูแผนภูมิที่ 2) มีการนำมูลฝอยชุมชนปริมาณเฉลี่ยวันละ 2,215 ตัน ไปกำจัดที่สถานที่ฝังกลบมูลฝอยดังกอร์ (Dangkor Landfill) (ข้อมูลจาก
กองควบคุมสถานที่ฝังกลบมูลฝอยดังกอร์ กรุงพนมเปญ เมื่อปี พ.ศ. 2561)
 |
|
แผนภูมิที่ 1: สำรวจการเพิ่มขึ้นของการผลิตมูลฝอยในกรุงพนมเปญไปจนถึงปี พ.ศ. 2573 (ค.ศ.2030)
|
|
ที่มา: สถาบันเทคโนโลยีแห่งกัมพูชา (Institute of Technology of Cambodia) เมื่อปี พ.ศ. 2558 (ค.ศ. 2015)
|
|
ปริมาณการกำจัดมูลฝอยชุมชนรายเดือน
|
 |
|
แผนภูมิที่ 2: แนวโน้มการกำจัดมูลฝอย ณ สถานที่ฝังกลบมูลฝอย กรุงพนมเปญ
ที่มา: กรุงพนมเปญ เมื่อ พ.ศ. 2560
|
หากจะพิจารณาการผลิตมูลฝอยเฉลี่ยต่อหัวจำเป็นจะต้องแยกระหว่าง “การผลิตมูลฝอยต่อครัวเรือน
(per capita household waste generation)” และ “การผลิตมูลฝอยมวลรวมเฉลี่ยต่อหัว (gross waste generation per capita)” ทั้งนี้ มูลนิธิเอเชีย (The Asia Foundation) วัดปริมาณการผลิตมูฝอยครัวเรือนได้ 0.498 กก./ครัวเรือน/วัน เมื่อปี พ.ศ. 2556 ซึ่งมีปริมาณเพิ่มขึ้นเล็กน้อยจากเมื่อปี พ.ศ. 2546 ที่องค์การความร่วมมือระหว่างประเทศแห่งญี่ปุ่น (JICA) เคยได้วัดไว้ได้ 0.487 กก./ครัวเรือน/วัน การผลิตมูลฝอยมวลรวมเฉลี่ยต่อหัวสามารถหาค่าได้โดยการแบ่งปริมาณมูลฝอยสุทธิที่สามารถจัดเก็บได้จากประชาชน จากนั้นให้พิจารณาการเปลี่ยนแปลงของอัตราประชากรและการจัดเก็บมูลฝอยในเมือง เมื่ออ้างอิงข้อมูล
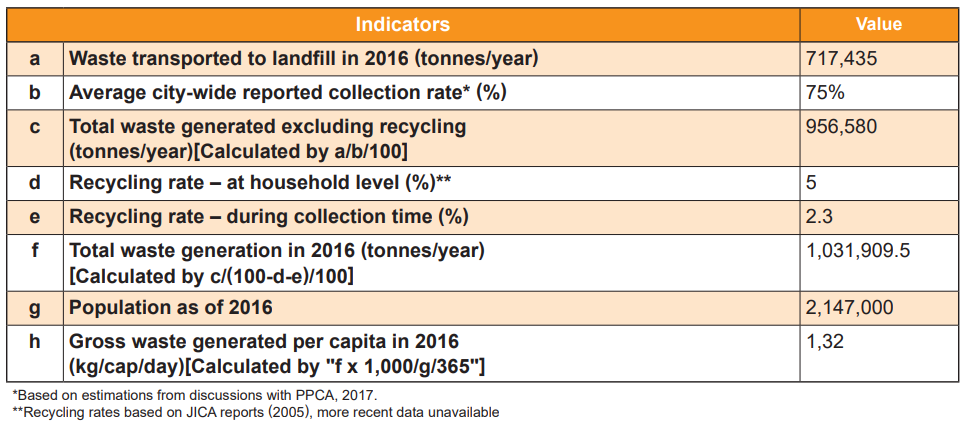
จากแหล่งที่มาหลายแห่งพบว่ามีปริมาณการผลิตมูลฝอยเพิ่มขึ้นจาก 0.74 กก./คน/วัน เมื่อปี พ.ศ. 2546 (Seng ฯลฯ พ.ศ. 2553) เป็น 1.32 กก./คน/วัน เมื่อปี พ.ศ. 2559 (คณะร่างเป็นผู้คำนวณโดยใช้ข้อมูลจากเมื่อปี พ.ศ. 2559)
|
ตารางที่ 1: ข้อมูลอัตราการผลิตมูลฝอยมวลรวมต่อคนเมื่อปี พ.ศ. 2559
|
|
เครื่องชี้วัด
|
ปริมาณ
|
|
ก
|
มูลฝอยที่ขนส่งไปยังสถานที่ฝังกลบมูลฝอย เมื่อปี พ.ศ. 2559 (ตัน/ปี)
|
717,435
|
|
ข
|
อัตราเฉลี่ยของการรายงานการจัดเก็บมูลฝอยในเมือง* (%)
|
75%
|
|
ค
|
ปริมาณสุทธิของมูลฝอยที่ผลิตได้โดยไม่รวมมูลฝอยรีไซเคิล (ตัน/ปี)
(วิธีคำนวณ: ก/ข/100)
|
956,580
|
|
ง
|
อัตราการรีไซเคิล-ในครัวเรือน** (%)
|
5
|
|
จ
|
อัตราการรีไซเคิล-ระหว่างการจัดเก็บ (%)
|
2.3
|
|
ฉ
|
ปริมาณสุทธิของการผลิตมูลฝอยเมื่อปี พ.ศ. 2559 (ตัน/ปี)
(วิธีคำนวณ: ค/(100-ง-จ)/100)
|
1,031,909.5
|
|
ช
|
จำนวนประชากรเมื่อปี พ.ศ. 2559
|
2,147,000
|
|
ซ
|
การผลิตมูลฝอยมวลรวมต่อคนเมื่อปี พ.ศ. 2559 (กก./คน/วัน)
วิธีคำนวณ: "ฉ x 1,000/ช/365"
|
1,32
|
|
*ข้อมูลจากการประเมินและหารือกับกรุงพนมเปญเมื่อปี พ.ศ. 2560
**อัตราการรีไซเคิลที่อ้างอิงจากรายงานขององค์การความร่วมมือระหว่างประเทศแห่งญี่ปุ่น (JICA) (พ.ศ. 2548) ทั้งนี้ ยังไม่มีข้อมูลที่เป็นปัจจุบันกว่านี้
|
ตามรายงานพบว่ามีอัตราการจัดเก็บมูลฝอยในเขตเมืองได้เกือบเต็มร้อย และสามารถจัดเก็บในเขตชานเมืองได้ประมาณร้อยละ 60 การศึกษาของโครงการตั้งถิ่นฐานมนุษย์แห่งสหประชาชาติ (พ.ศ. 2557) ได้มุ่งเน้นไปที่เขตชานเมือง ซึ่งร้อยละ 40 ของพื้นที่เป็นที่ตั้งของชุมชนยากจนในกรุงพนมเปญที่ไม่สามารถเข้าถึงการจัดเก็บขยะได้
จากรายงานขององค์การความร่วมมือระหว่างประเทศแห่งญี่ปุ่น (JICA) (พ.ศ. 2548) พบว่าประมาณร้อยละ 7.3 ของมูลฝอยที่เกิดขึ้นซึ่งมีปริมาณเฉลี่ย 75,000 ตัน/ปี (จากข้อมูลเมื่อปีพ.ศ. 2559) ได้ถูกนำไป
รีไซเคิลโดยหน่วยงานรีไซเคิลนอกระบบของกรุงพนมเปญ
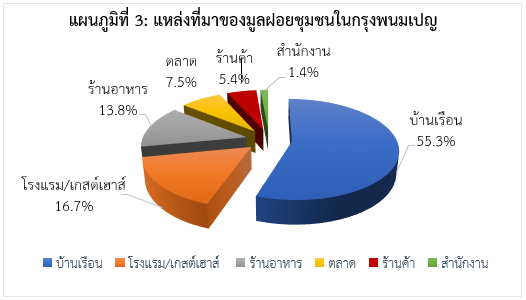
มีการจัดเก็บและขนส่งมูลฝอยชุมชนไปยังสถานที่กำจัดมูลฝอยขั้นสุดท้ายที่ปะปนอยู่ในเขตพื้นที่ทางธรรมชาติซึ่งกระจายอยู่ใน 12 เขต รอบเมือง แผนภูมิที่ 3 แสดงถึงสัดส่วนของมูลฝอยที่จำแนกตามแหล่งที่มา ดังนี้ ขยะในครัวเรือนมีสัดส่วนมากที่สุด (ร้อยละ 55.3) รองลงมาคือโรงแรม/เกสต์เฮาส์
(ร้อยละ 16.7) ร้านอาหาร (ร้อยละ 13.8) และตลาด (ร้อยละ 7.5)
- ประเภทของมูลฝอย
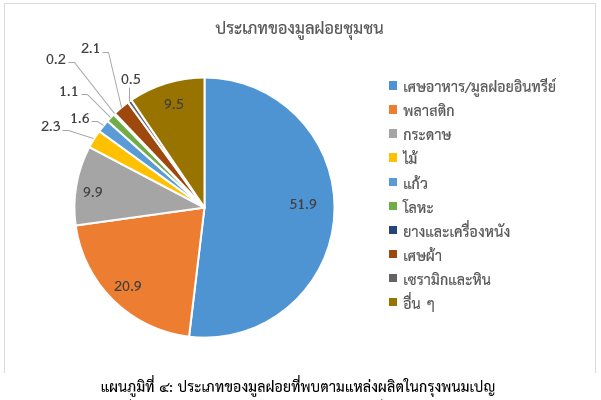
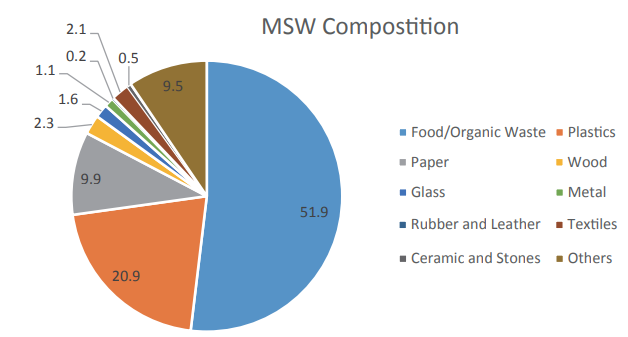
แผนภูมิที่ 4 แสดงถึงประเภทของตัวอย่างมูลฝอยชุมชนที่ได้จากการผลิตในกรุงพนมเปญ โดยทั่วไปแล้ว
มูลฝอยในกรุงพนมเปญประกอบด้วยมูลฝอยอินทรีย์ (organic waste) มากกว่าร้อยละ 50 พลาสติก
(ร้อยละ 9 ได้แก่ ถุงพลาสติก และพลาสติกชนิดอื่น ๆ และขวดพลาสติก PET) เศษหญ้าและไม้
(ร้อยละ 2.3) โดยทั่วไปมักพบว่าสัดส่วนของมูลฝอยอินทรีย์มีแนวโน้มที่จะสูงกว่ามูลฝอยรีไซเคิลในสถานที่กำจัดมูลฝอยขั้นสุดท้ายเมื่อเทียบกับในขั้นตอนการผลิตมูลฝอยเนื่องจากผู้ผลิตมูลฝอยและคนเก็บขยะ
ตามท้องถนนได้คัดแยกมูลฝอยรีไซเคิลบางส่วนแล้ว เช่น ขวดพลาสติก PET กระป๋อง และโลหะ
 |
|
แผนภูมิที่ 4: ประเภทของมูลฝอยที่พบตามแหล่งผลิตในกรุงพนมเปญ
|
|
ที่มา: มูลนิธิเอเชีย (The Asia Foundation) เมื่อปี พ.ศ. 2556
|
- การจัดเก็บและขนส่ง
บริษัท CINTRI Cambodia Co. Ltd ผู้ประกอบการเอกชนแห่งหนึ่งเป็นผู้รับผิดชอบจัดเก็บและขนส่ง
มูลฝอยที่เกิดขึ้นในกรุงพนมเปญ และในหลายปีที่ผ่านมานี้ได้ค่อย ๆ ขยายเขตพื้นที่ให้ครอบคลุมทั่วเมือง อย่างไรก็ตาม การให้บริการในพื้นที่รอบนอกเมืองยังมีข้อจำกัดในด้านขีดความสามารถและมักจะไม่สามารถทำให้เป็นไปตามมาตรฐานทางเทคนิคที่วางไว้ได้ทำให้มีการร้องเรียนต่าง ๆ มากมาย ได้แก่
การเก็บมูลฝอยล่าช้าและไม่ถูกหลักสุขาภิบาล (การรั่วไหลของมูลฝอยอินทรีย์ในพื้นที่สาธารณะและ
การรั่วซึมของน้ำชะมูลฝอยจากรถเก็บมูลฝอย) ฯลฯ (ข้อมูลจากกรุงพนมเปญ เมื่อปี พ.ศ. 2560)
ในทางกลับกันความตระหนักของประชาชนเกี่ยวกับการจัดการมูลฝอยและสุขอนามัยสาธารณะค่อนข้างจะต่ำ เนื่องจากลักษณะการทิ้งขยะในพื้นที่ที่กำหนดไว้ (การบรรจุไม่เหมาะสมหรือการทิ้งไม่ตรงตามตารางเวลาที่กำหนด) จึงมีมูลฝอยจำนวนมากที่ยังไม่ได้รับการจัดเก็บและคงถูกทิ้งไว้ให้อยู่ตามท้องถนน ที่ดินว่างเปล่า คลอง และริมแม่น้ำ ทำให้การสุขาภิบาลชุมชนและสภาพแวดล้อมเสื่อมโทรม
- การจัดการสถานที่กำจัดมูลฝอยขั้นสุดท้าย Management of Final Disposal Site
การบำบัดและกำจัดมูลฝอยชุมชนภายใต้อำนาจการควบคุมในกรุงพนมเปญแทบจะทั้งหมดขึ้นอยู่กับสถานที่ฝังกลบมูลฝอยดังกอร์ องค์การความร่วมมือระหว่างประเทศแห่งญี่ปุ่น (JICA) ได้ให้การสนับสนุน
ในการพัฒนาสถานที่ฝังกลบมูลฝอยแห่งนี้ โดยได้เริ่มดำเนินการเมื่อเดือนกรกฎาคม 2552 ตามด้วยการ
ปิดตัวลงของสถานที่ฝังกลบมูลฝอยรุ่นบุกเบิกที่มีชื่อว่า “สะโตเอ็งเมียนเชย (Stoeng Mean Chey)”
ซึ่งที่นี่เคยทำให้มีพื้นที่ในการฝังกลบมูลฝอยเพียงพอ
คาดว่ามีการจัดเก็บและขนส่งมูลฝอยไปยังสถานที่ฝังกลบมูลฝอยดังกอร์ในกรุงพนมเปญเมื่อปี พ.ศ. 2560 ปริมาณเฉลี่ย 2,215 ตัน/วัน ในปี 2560 ตารางที่ 2 แสดงปริมาณมูลฝอยที่จัดเก็บได้จากแหล่งต่าง ๆ
|
ตารางที่ 2: ปริมาณมูลฝอยชุมชนจำแนกตามแหล่งต่าง ๆ เมื่อปีพ.ศ. 2557 และ พ.ศ. 2560
|
|
แหล่ง
|
พ.ศ. 2557
|
พ.ศ. 2560
|
|
ตัน/วัน
|
%
|
ตัน/วัน
|
%
|
|
บริษัท CINTRI
|
1,653
|
97
|
2,172.74
|
98
|
|
ตลาด Doeum Kor
|
28
|
1.6
|
27.7128
|
1.3
|
|
ตลาด Prek Phnov
|
n.a.
|
n.a.
|
3.27
|
0.1
|
|
ตลาด New Mean Chey
|
n.a.
|
n.a.
|
0.09
|
0.1
|
|
โรงฆ่าสัตว์
|
8
|
0.5
|
9.37
|
0.4
|
|
สำนักโยธาธิการ
|
10
|
0.6
|
2.85
|
0.1
|
|
อื่น ๆ
|
6
|
0.4
|
0.12
|
0.1
|
|
รวม
|
1,705
|
|
2,215.15
|
|
|
ที่มา: กองควบคุมสถานที่ฝังกลบมูลฝอยดังกอร์ (Phnom Penh Landfill Authority), พ.ศ. 2561
|
กรุงพนมเปญได้มีการนำวิธีการจัดการมูลฝอยที่ได้รับคำแนะนำมาจากองค์การความร่วมมือระหว่างประเทศแห่งญี่ปุ่น (JICA) มาใช้ เช่น การใช้ดินกลบ ฯลฯ เมื่อก่อนหน้าปี พ.ศ. 2553 อย่างไรก็ดี ได้ยกเลิกการใช้วิธีนี้ไปเนื่องจากทำให้พื้นที่เกิดความเสียหายอย่างร้ายแรงอันสืบเนื่องมาจากน้ำท่วมอย่างหนักในหลายภูมิภาคของประเทศกัมพูชาส่งผลให้เกิดการพังทลายของสถานที่ฝังกลบมูลฝอย ทั้งในพื้นที่ A และพื้นที่ B เมื่อสถานที่ฝังกลบมูลฝอยไม่มีความหนาแน่นเพียงพอจึงทำให้อายุการใช้งานของสถานที่ฝังกลบมูลฝอยสั้นลงอย่างรวดเร็ว อีกทั้ง มีการเสื่อมโทรมของสุขอนามัยทำให้เกิดกลิ่นไม่พึงประสงค์และแพร่พันธุ์ของแมลง
ที่เป็นพาหะนำโรคและแมลงมีพิษโดยเฉพาะอย่างยิ่งในช่วงฤดูฝน
ในปัจจุบันน้ำชะมูลฝอยจากสถานที่ฝังกลบมูลฝอยได้ไหลไปรวมกันในบ่อระเหยเพื่อทำให้เข้มข้น แต่ยังไม่กระบวนการบำบัดใด ๆ เกิดขึ้นต่อจากนี้ เนื่องจากคุณสมบัติทางธรณีวิทยาของน้ำชะมูลฝอยที่หมักไว้สามารถแทรกซึมเข้าไปยังผิวดินปนเปื้อนดินในบริเวณใกล้เคียงรวมถึงระบบน้ำบาดาล
ยังคงมีการกำจัดและบำบัดมูลฝอยชุมชนโดยเอกชนที่ผิดกฎหมาย ซึ่งเป็นผลมาจากการจัดเก็บและบริการขนส่งมูลฝอยในเมืองที่ไม่เพียงพอตลอดจนการทิ้งมูลฝอยในพื้นที่เปิดและพื้นที่ส่วนบุคคล และการเผา
มูลฝอยในพื้นที่ส่วนบุคคล
มีการกำจัดมูลฝอยแบบผิดกฎหมายปริมาณเฉลี่ย 117,530 ตัน/ปี คิดเป็นร้อยละ 11.7 ของมูลฝอยทั้งหมดในกรุงพนมเปญ เมื่อปีพ.ศ. 2558 (ข้อมูลรวบรวมจากหน่วยงานด้านสิ่งแวดล้อมในประเทศกัมพูชา กระทรวงสิ่งแวดล้อม เมื่อปี พ.ศ. 2558)
- การรีไซเคิลและการส่งออกมูลฝอย
ถึงจะไม่มีข้อมูลที่แน่ชัดเกี่ยวกับปริมาณมูลฝอยรีไซเคิลในกัมพูชาแต่ได้มีการเฝ้าสังเกตการณ์ขอบเขตของกิจกรรมการรีไซเคิลในกรุงพนมเปญ องค์การไม่แสวงผลกำไรท้องถิ่น ได้แก่ CSARO และ COMPED2
ได้รับมูลฝอยอินทรีย์จากตลาด Daeum Kor เพื่อนำไปทำเป็นปุ๋ยอินทรีย์และเอกชนหลายแห่งกำลังสำรวจศักยภาพทางธุรกิจโดยมุ่งเป้าหมายไปที่มูลฝอยอินทรีย์และอนินทรีย์เพื่อตอบสนองการเพิ่มปริมาณการกำจัดมูลฝอยในสถาที่ฝังกลบมูลฝอยขั้นสุดท้าย และกรุงพนมเปญกำลังสำรวจมาตรการในการจัดการบริษัทรีไซเคิลเช่นกัน
ขีดความสามารถในการรีไซเคิลกำลังท้าทายทั้งกรุงพนมเปญและประเทศกัมพูชาในการเปลี่ยนถ่ายจากสังคมที่จัดการมูลฝอยและทรัพยากรแบบเส้นตรง (การสกัด ประมวลผล บริโภค และกำจัดทรัพยากร)
ไปสู่การจัดการแบบวงกลมซึ่งจะส่งผลให้เกิดการสูญเสียทางเศรษฐกิจและความเสื่อมสิ่งแวดล้อมลดลง
การผลิตและการจัดเก็บมูลฝอยรีไซเคิลทั่วประเทศและกิจกรรมการรีไซเคิลในประเทศกัมพูชามีปริมาณจำกัดเนื่องจากการขาดอุตสาหกรรมรีไซเคิล โครงสร้างพื้นฐานการรีไซเคิล และตลาดสำหรับวัสดุ
และผลิตภัณฑ์รีไซเคิล ดังนั้น จึงมีการส่งออกมูลฝอยและวัสดุที่สามารถรีไซเคิลได้บางส่วนไปยังประเทศเพื่อนบ้านเพื่อนำไปรีไซเคิล
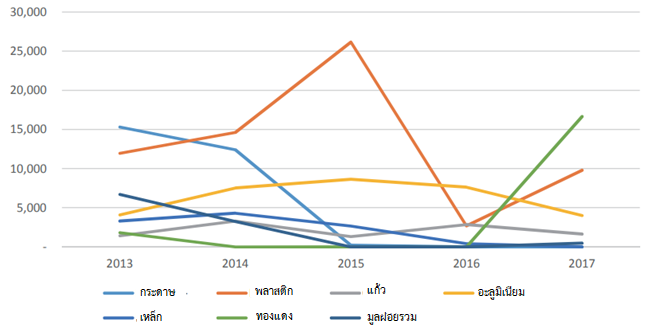
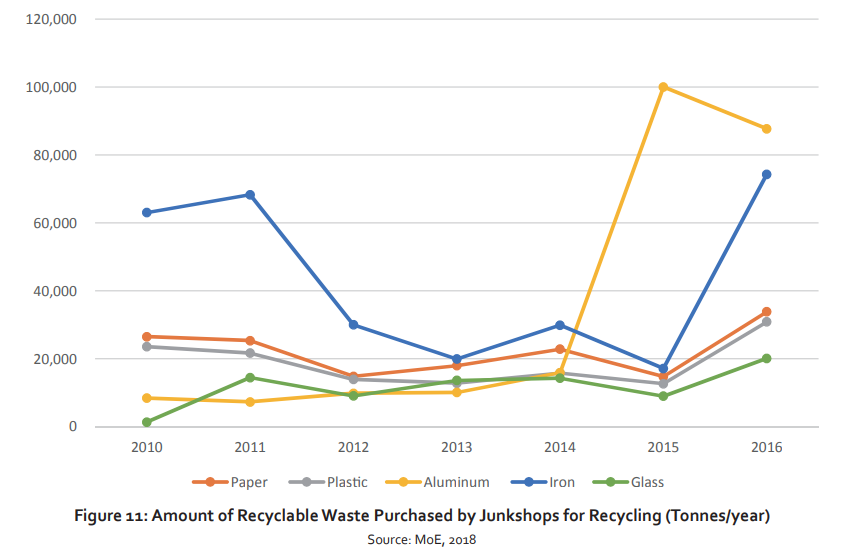
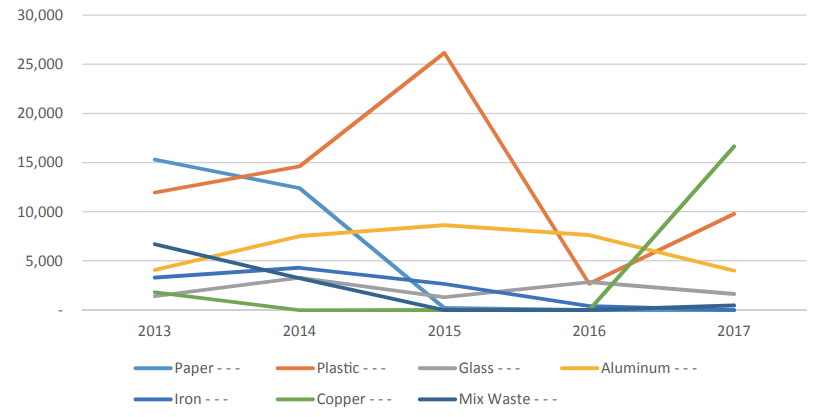
แผนภูมิที่ 5 แสดงปริมาณขยะรีไซเคิลที่ร้านรับซื้อขยะทั่วประเทศกัมพูชาได้ซื้อเพื่อนำไปรีไซเคิล ได้แก่ กระดาษ พลาสติก (ถุงและขวดพลาสติก) อลูมิเนียม (สิ่งของที่แตกหักและกระป๋อง) เหล็ก และขวดแก้ว/ เศษขวดแก้วแตก และแผนภูมที่ 11 แสดงแนวโน้มของขยะรีไซเคิลที่ส่งออกภายใต้การอนุมัติของกระทรวงสิ่งแวดล้อม (กระทรวงสิ่งแวดล้อม ประเทศกัมพูชา, พ.ศ. 2561) แผนภูมิทั้งสองแสดงให้เห็นถึงแนวโน้มการขยายตัวของการนำวัสดุกลับมาใช้ใหม่ในประเทศกัมพูชาในช่วงไม่กี่ปีที่ผ่านมานี้ ข้อมูลอีกชุดจากกระทรวงสิ่งแวดล้อม เมื่อปี พ.ศ. 2556 และพ.ศ. 2557 (ตารางที่ 3) ระบุว่าแนวโน้มการส่งออกวัสดุ
ไปยังประเทศอื่น เช่น ประเทศไทย เกาหลีใต้ เวียดนาม จีน สิงคโปร์ มาเลเซีย และไต้หวัน ทำให้มีการรั่วไหลของทรัพยากรที่มีประสิทธิภาพซึ่งอาจใช้ทดแทนการนำเข้าทรัพยากรบริสุทธิ์ได้ นอกจากนี้
การเพิ่มขึ้นของการซ่อมแซมวัสดุถือเป็นการพัฒนาที่น่าให้การสนับสนุน ความพยายามยังจำเป็นเพื่อให้มั่นใจว่ากิจกรรมการซ่อมแซมเหล่านี้ได้คำนึงถึงการลดความเสี่ยงด้านสุขภาพและสิ่งแวดล้อมด้วย
 |
|
แผนภูมิที่5: ปริมาณมูลฝอยรีไซเคิลที่ร้านรับซื้อขยะซื้อเพื่อนำไปรีไซเคิล (ตัน/ปี)
ที่มา: กระทรวงสิ่งแวดล้อม, ข้อมูลเมื่อปี พ.ศ. 2561
|
 |
|
แผนภูมิที่ 6: ปริมาณการส่งออกมูลฝอยภายใต้การควบคุมของกระทรวงสิ่งแวดล้อม (ตัน/ปี)
ที่มา: กระทรวงสิ่งแวดล้อม, พ.ศ. 2561
|
|
ตารางที่ 3 ปริมาณการส่งออกมูลฝอยรีไซเคิลและประเทศปลายทางในปีพ.ศ. 2556 และ พ.ศ.2557
|
|
ประเภทวัสดุ
|
ปริมาณ (ตัน/ปี)
|
ส่งออกไปยัง
|
|
พ.ศ. 2556
|
พ.ศ. 2557
|
|
เศษเหล็ก
|
3,300
|
4,303
|
ไทย
|
|
เศษอะลูมิเนียม
|
4,075
|
7,523
|
เกาหลีใต้ สิงคโปร์ จีน และไต้หวัน
|
|
เศษทองแดง
|
18,000
|
0
|
เกาหลีใต้
|
|
มูลฝอยรีไซเคิล
|
6,700
|
3,250
|
ไทย, เวียดนาม
|
|
เศษกระดาษ
|
15,300
|
12,400
|
ไทย, เวียดนาม
|
|
เศษขวดแตก
|
1,417
|
3,277
|
มาเลเซีย
|
|
เศษพลาสติก
|
11,966
|
14,634
|
เวียดนาม, จีน
|
|
ที่มา: กระทรวงสิ่งแวดล้อม, พ.ศ. 2558
|
แหล่งที่มาของข้อมูล
กรุงพนมเปญ. 2561. Waste Management Strategy and Action Plan of Phnom Penh 2018-2035 (หน้า 15-22). ค้นเมื่อ 22 มิถุนายน 2563. แหล่งที่มา:https://www.iges.or.jp/en/publication_documents/pub/policysubmission/en/6688/Phnom+Penh+Waste+management+strategy+and+action+plan+2018-2035_web.pdf.
Best Practice of Phnom Penh: Municipal Solid Waste (MSW) Management
- Legal and Policy Framework
Various laws, regulations, declarations, sub-decrees and instructions have been issued by both national agencies as well as PPCA over the years relating to the management of MSW.
National Regulations
- Sub-Decree On Solid Waste Management, No. 36 (1999)
- Inter-Ministerial Declaration of Ministry of Interior - Ministry of Environment on Waste and Solid Waste Management in Province / Municipalities of Cambodia, No. 80 (2003)
- Sub - Decree on Urban Solid Waste Management, No. 113 (2015)
- Waste Management Strategy and Action Plan of Cambodia (planned)
Sub-national Regulations
- Draft Strategy and Methodology for Improving Waste Management and Cleansing, Collection and Transport of Solid Waste in Phnom Penh Capital
- Sechkdey Chun Damnoeng (Notification) On Waste Storage, Cleansing, Waste Discharge and Penalties on Improper Waste Disposal in Phnom Penh Municipality, No. 13 (2013)
- Instruction Plan on the Application of Penalties to Promote Environmental Sanitation Raising in Phnom Penh Municipality, No. 09 (2010)
- Sechkdey Nainoam (Instruction) on Penalties on Waste Disposal in Public Areas, No. 16 (2010)
- Instruction Plan on Waste Separation Promotion in Phnom Penh Municipality, No. 08 (2010)
- Waste Storage, Cleansing, Waste Discharge and Penalties on Improper Waste Disposal in Phnom Penh Municipality (2013)
- Waste Generation
(See Figure 1) The prospective trend of waste generation amount in Phnom Penh which is estimated by Institute of Technology of Cambodia presents continuous growth of waste generation towards until 2030. MSW collected for landfill has increased exponentially over the past two decades due to an increase in population in Phnom Penh as well as increase in waste generation by source. However, thanks to the enormous efforts of the Phnom Penh Capital Administration (PPCA), the collection service provider and residents, a rising trend in collection amount has been seen over the years (see Figure 2). In 2017, the average daily amount of MSW taken to the Dangkor final landfill was 2,215 tonnes/day (Dangkor Landfill Authority, PPCA, 2018).
 |
|
Figure 1: Prospect of Waste Generation Growth in Phnom Penh until 2030
|
|
Source: Institute of Technology of Cambodia, 2015
|
|
Monthly Disposal Amount (t)
|
 |
|
Figure 2: Trend of MSW Disposal at Landfill, Phnom Penh, Source: PPCA, 2017
|
With regards to waste generation per capita, it is important to distinguish between “per capita household waste generation” and “gross waste generation per capita”. The most recent per capita household waste generation measurement was carried out by the Asia Foundation (2013) and equates to 0.498 kg/capita/day, slightly higher than the JICA (2003) figure of 0.487 kg/capita/day.
Gross waste generation rate per capita is calculated by dividing the total waste collected by the population, thus varies in line with changes in population or waste collection ratio in the city. Based on information from various sources, the gross generation rate was found to increase from 0.74 kg/capita/day in 2003 (Seng et al., 2010) to approximately 1.32 kg/capita/day in 2016 (calculated by drafting team based on 2016 data).
|
Table 1: Gross Waste Generation per Capita based on 2016 Data
|
 |
Reportedly, in central khans, the collection rate is close to 100% while in outer khans it is around 60%. A UN Habitat study (2014) focused on outer khans estimated that nearly 40% of urban poor communities in Phnom Penh had no access to solid waste collection.
According to JICA reports (2005), around 7.3% of all waste generated, estimated at over 75,000 tonnes a year (based on 2016 data) was recycled through the informal recycling sector in Phnom Penh.
MSW collected and brought into the final disposal sites from 12 Khans across the city are largely mixed in nature. Figure 3 gives a breakdown of MSW by source. Of all sources, household waste occupies the largest portion (55.3%), followed by hotels/guesthouses (16.7%), restaurants (13.8%) and markets (7.5%).

- Waste Composition
Figure 4 illustrates the composition of MSW sampled at generation points in Phnom Penh. As is typical for the average Cambodian city, over 50% of waste at the discharge point is organic waste, followed by plastics (20.9% - including plastic bags, other plastics and PET bottles), papers (9.9%), grass and wood (2.3%). It is generally considered that the percentage of organic waste tends to be higher and recyclable waste lower at the final disposal site compared to at the generation stage as some recyclable wastes such as hard plastics, PET bottles, cans and metals are extracted at source by waste producers, removed by street scavengers before collection, or removed during collection by collection crews.
 |
|
Figure 4: Waste Composition at Generation Point in Phnom Penh
|
|
Source: Asia Foundation, 2013
|
- Collection and Transportation
A private operator company, CINTRI Cambodia Co. Ltd is currently responsible for collection and transportation of the waste generated in the city, and has gradually expanded its geographical coverage over the years. However, the service in peripheral areas of the city is still limited in capacity and often does not satisfy the technical standard. Complaints are frequency received related to delayed collection and unsanitary collection practices (leakage of organic waste in public areas and overspill of leachate from collection trucks), among others (PPCA, 2017).
On the other hand, awareness among citizens of waste management and public hygiene tends to be low. As a result, due to the manner in which wastes are discharged at the designated areas (improperly packed or not following designated timetables), much uncollected litter remains on roads, vacant land, canals and riversides, causing degradation of urban sanitation and the living environment.
- Management of Final Disposal Site
Phnom Penh relies almost entirely on Dangkor landfill site for the final treatment and disposal of MSW generated within the jurisdiction. The landfill, developed with the assistance of JICA, started operating in July 2009 following the closure of its predecessor, Stoeng Mean Chey landfill site, which had reached capacity.
In 2017, the amount of MSW collected and brought in to Dangkor landfill site in Phnom Penh is estimated to be about 2,215 tonnes/day on average. Table 2 shows the aggregate incoming waste from different sources.
|
Table 2: Amounts of MSW Disposed by Source in 2014 and 2017
|
|
Source
|
2014
|
2017
|
|
T/day
|
%
|
T/day
|
%
|
|
CINTRI
|
1,653
|
97
|
2,172.74
|
98
|
|
Doeum Kor Market
|
28
|
1.6
|
27.7128
|
1.3
|
|
Prek Phnov Market
|
n.a.
|
n.a.
|
3.27
|
0.1
|
|
New Mean Chey Market
|
n.a.
|
n.a.
|
0.09
|
0.1
|
|
Slaughter houses
|
8
|
0.5
|
9.37
|
0.4
|
|
Public Work Dept.
|
10
|
0.6
|
2.85
|
0.1
|
|
Others
|
6
|
0.4
|
0.12
|
0.1
|
|
Total
|
1,705
|
|
2,215.15
|
|
|
Source: Phnom Penh Landfill Authority, 2018
|
Prior to 2010, the recommended management practice forwarded by JICA, such as applying cover soil was followed. However, this was discontinued due to grave damage to the site caused by serious flooding, which also affected most regions of Cambodia and resulted in the collapse of landfill pile both in Area A and Area B. Without landfill compaction, the remaining life of the landfill site rapidly shortened, while hygiene also deteriorated resulting in offensive odors and breeding of disease vectors and noxious insects, which especially intensifies during rainy seasons.
The leachate from the landfill site is now collected to an evaporation pond for concentration, but no treatment process is currently employed. Due to the geological features of the site, collected leachate can infiltrate the ground, contaminating the soil of adjacent areas as well as the groundwater system.
Illegal disposal and private treatment of municipal waste are still commonplace. This is partially a result of the inadequate waste collection and transportation service within the city, as well as dumping of wastes in open and private land and open burning in private areas.
In 2015, approximately 117,530 tonnes/year of MSW was illegally disposed of in such manner, equivalent to 11.7% of the waste generated in the Phnom Penh (Inventory Data Collected from Departments of Environment in Cambodia, MoE, 2015).
- Recycling and Export of Solid Waste
While there is a general lack of data on the actual amount of recycled waste in Cambodia, recycling activities of limited scale are observed in Phnom Penh. In addition to local NGOs such as CSARO and COMPED2 which accept organic waste from Daeum Kor Market for composting, several private companies are exploring the business potential targeting both organic and inorganic wastes. In response to increasing stream of incoming waste to final disposal site, PPCA is also exploring potential measures for engaging recycling companies.
Limits to recycling capacity are posing a major challenge to both Phnom Penh and Cambodia in the transition from a society based on linear approach to waste/resource management (in which resources are extracted, processed, consumed and disposed of) to the one based on circular approach, resulting in wastage of economic assets and environmental degradation. Whilst a certain amount of recyclable waste is generated and collected nationwide, domestic recycling activities within Cambodia are limited due to the lack of recycling industry, recycling infrastructures and market for recyclable materials and recycled products. Therefore, some of the recyclable wastes and materials are exported to neighboring countries for recycling purpose.
Figure 5 presents the amount of recyclable wastes purchased by junkshops across Cambodia for recycling including paper, plastic (bags and plastic bottles), aluminum (broken items and cans), iron, and glass bottles/ broken bottle glass, while Figure 6 presents the trend of such recyclable waste exported under the permission scheme of the MoE (MoE Cambodia, 2018), both graphs illustrate expanding trend of material recovery in Cambodia in the past a few years. Another MoE data from 2013 and 2014 (Table 3) indicates that the recovered materials were exported to other countries such as Thailand, South Korea, Vietnam, China, Singapore, Malaysia and Taiwan, causing an outflow of potential resources which could otherwise alternate virgin resource imports. In addition, while the increase of material recovery is a welcoming development, efforts are also required to ensure such recovery activities are managed to minimise the health and environmental risks.
 |
|
Figure 5: Amount of Recyclable Waste Purchased by Junkshops for Recycling (Tonnes/year)
Source: MoE, 2018
|
 |
|
Figure 6: Amount of Recyclable Waste Exported under the Due Process of MoE (Tonnes/year) Source: MoE, 2018
|
|
Table 3: Amounts of Exported Recyclables and Destination Countries in 2013 and 2014
|
 |
|
Source: MoE Cambodia, 2015
|
Source:
Phnom Penh Capital Administration. (2018). Waste Management Strategy and Action Plan of Phnom Penh 2018-2035 (P. 15-22). Retrieved on: 22 June 2020. From: https://www.iges.or.jp/en/publication_documents/pub/policysubmission/en/6688/Phnom+Penh+Waste+management+strategy+and+action+plan+2018-2035_web.pdf.
เอกสารแนบ : Best Practice - กรุงพนมเปญ Municipal Solid Waste (MSW) Management (พรรณระวี).pdf